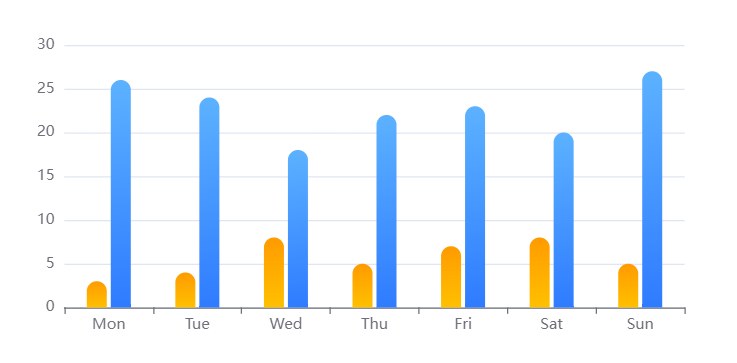
比如,要实现如下图的带渐变色的柱状图,应该怎么做?通过看官网,以及网上文章自己总结如下:
methods: {myecharts() {var myChart = this.$echarts.init(document.getElementById(‘barChart’))// 指定图表的配置项和数据var option = {xAxis: {data: [‘Mon’, ‘Tue’, ‘Wed’, ‘Thu’, ‘Fri’, ‘Sat’, ‘Sun’]},yAxis: {},series: [{type: ‘bar’,data: [3, 4, 8, 5, 7, 8, 5],barWidth: ’16’,itemStyle: {normal: {borderRadius: [8, 8, 0, 0],color: new this.$echarts.graphic.LinearGradient(0, 1, 0, 0, [{ offset: 0, color: ‘#FFC000’ },{ offset: 1, color: ‘#FF9B00’ }])}}},{type: ‘bar’,data: [26, 24, 18, 22, 23, 20, 27],barWidth: ’16’,itemStyle: {normal: {borderRadius: [8, 8, 0, 0],color: new this.$echarts.graphic.LinearGradient(1, 1, 0, 0, [{ offset: 0, color: ‘#2F7BFF’ },{ offset: 1, color: ‘#5CB2FF’ }])}}}]}// 使用刚指定的配置项和数据显示图表。myChart.setOption(option)}}
每给一个color赋值的时候,需要使用new this.$echarts… ,以免覆盖前面的颜色。